Section 2 of 5
What the Data Shows
Veterinary measurement, published life-expectancy figures and screening schemes — reported from named studies.
-
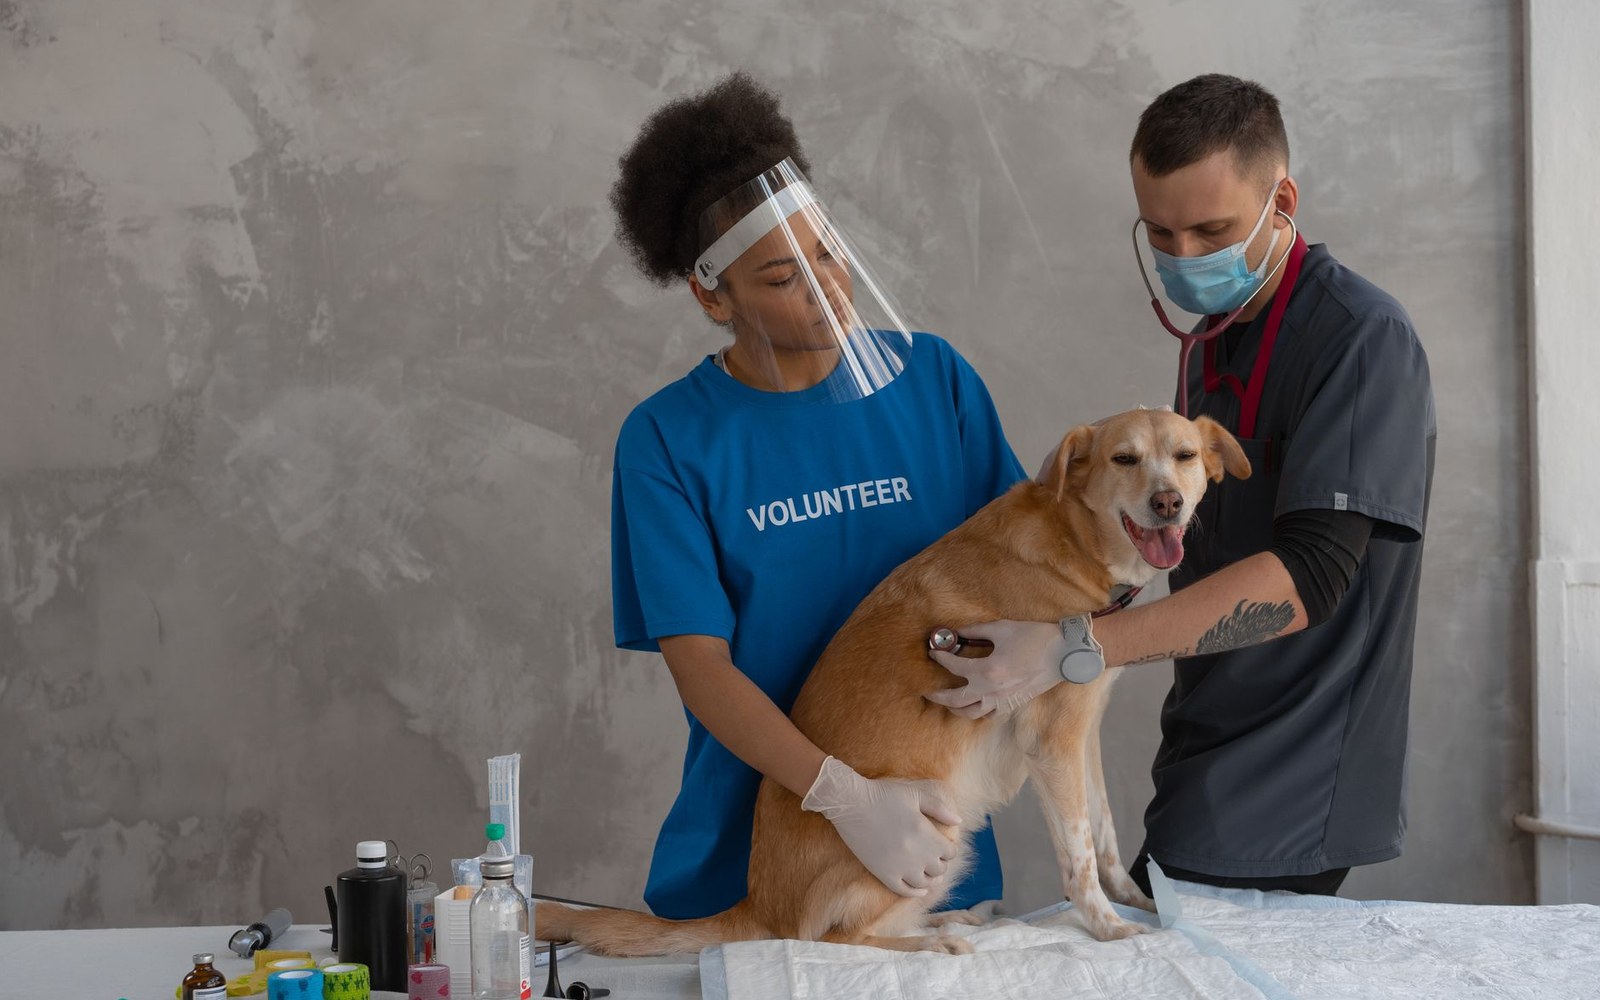
A grade is recorded against the individual dog, never against the breed.
Photo: Mikhail Nilov / PexelsLeading this section
BOAS Grade 0 to Grade 3: What the Cambridge Assessment Measures
The Respiratory Function Grading Scheme run jointly by the Kennel Club and the University of Cambridge — the exercise protocol, the four-grade scale, and the published grade distributions for bulldogs, French bulldogs and pugs as of the most recently reported cohort.
The RVC's Life-Expectancy Figures, Breed by Breed
The Royal Veterinary College's VetCompass programme and its published median-age-at-death tables — which breeds appear in the data, the sample sizes behind each figure and how the programme's primary-care database method differs from insurance-based studies.
What the Data Shows
Chiari Malformation, Syringomyelia and the MRI Grading Protocol for Cavaliers
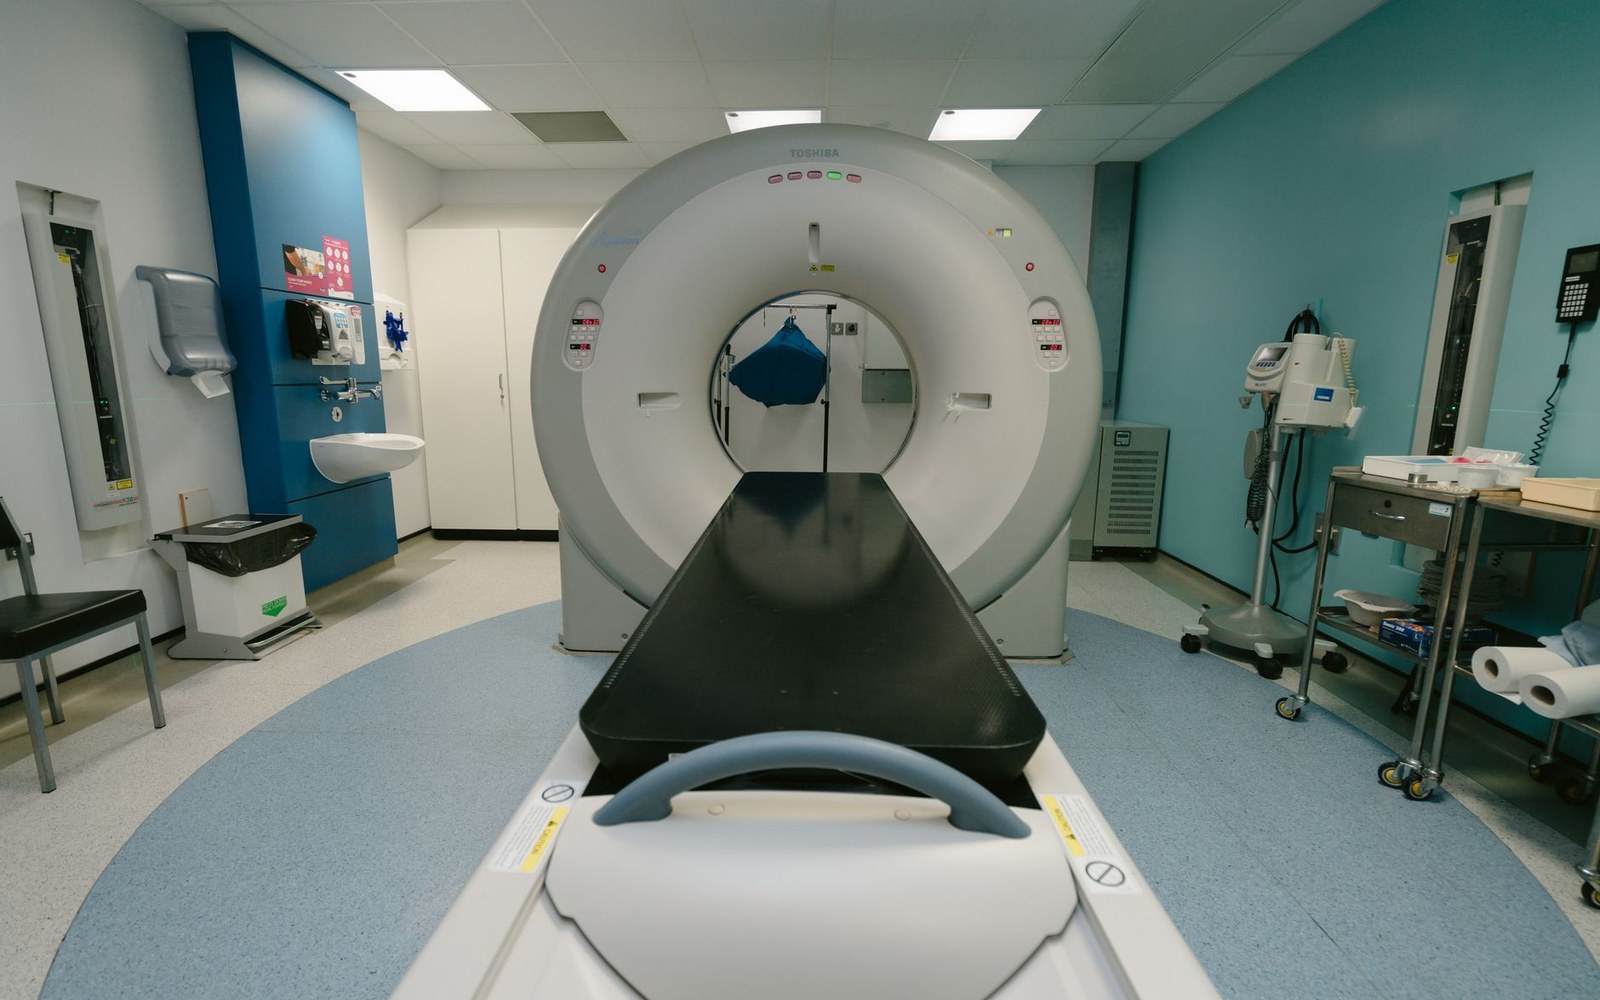
The screening protocol for Chiari-like malformation and syringomyelia in cavalier King Charles spaniels — the MRI grades defined by the scheme, published prevalence figures from named studies, and the Kennel Club's position on the scheme within its health-testing requirements.
What the Data Shows

Three DNA Tests, Three Different Inheritance Patterns
PRA (progressive retinal atrophy), degenerative myelopathy (DM) and MDR1 drug sensitivity as examples of single-gene screening — the variants each test identifies, which breeds they apply to and how the Kennel Club's Health Test Results Finder presents the published results.
What the Data Shows
Scoring at the Joint: How Hip and Elbow Assessment Works
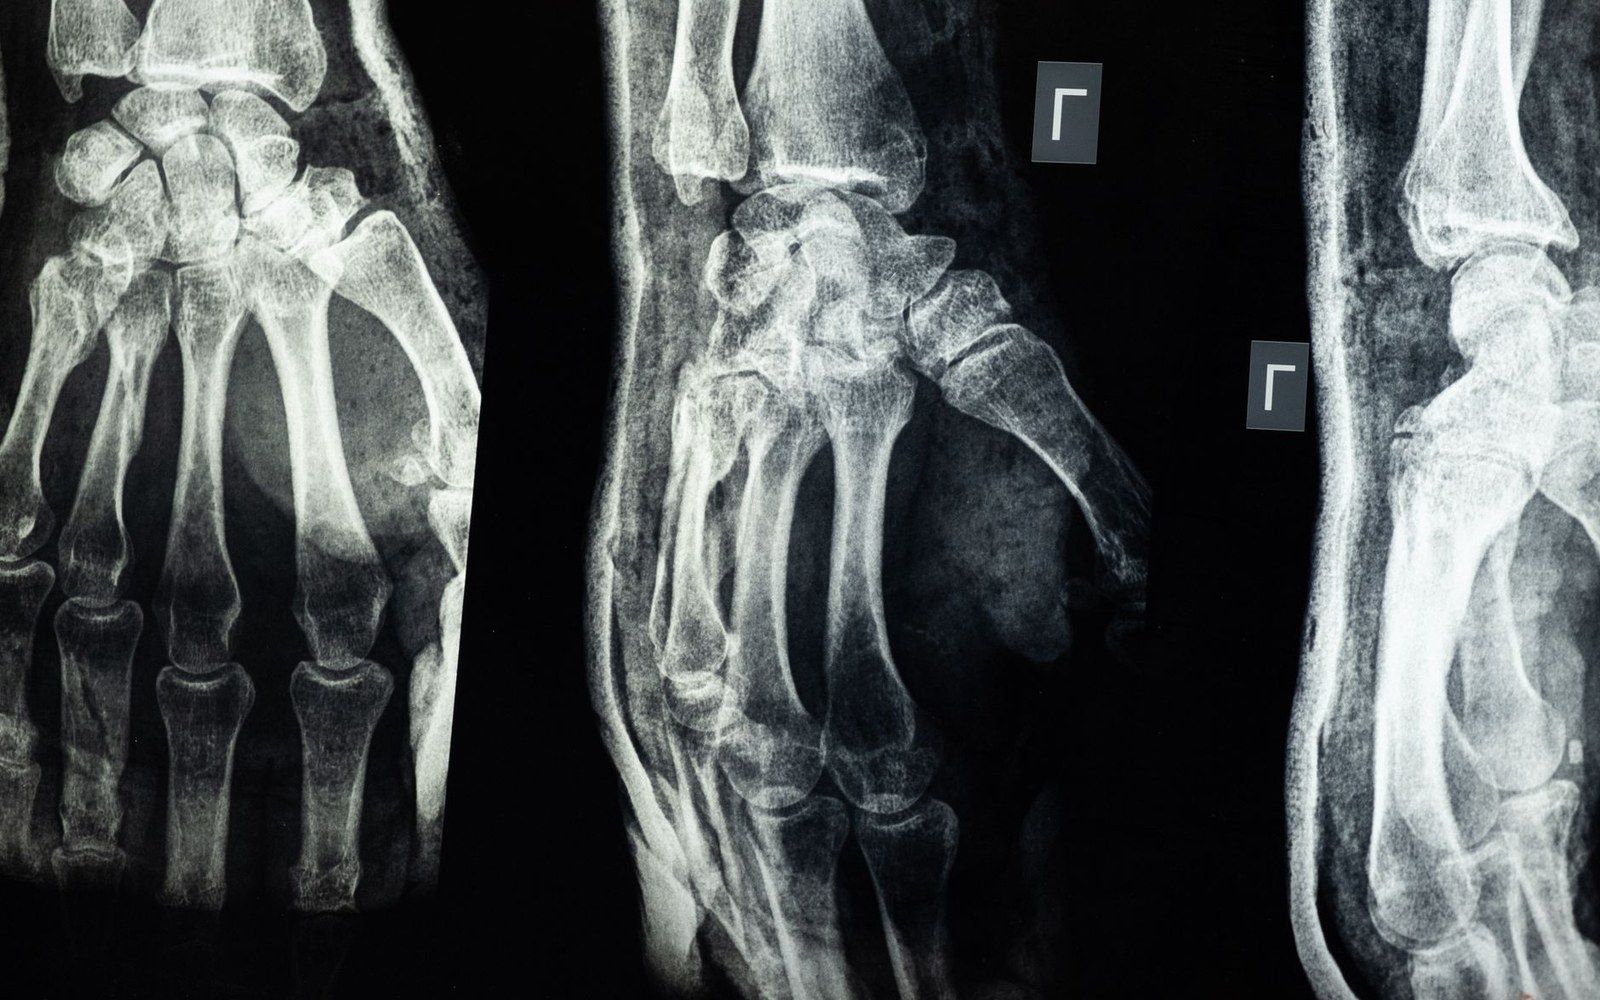
The BVA/Kennel Club hip-scoring scheme and the BVA/KC/ISDS elbow scheme — the radiographic criteria, the score ranges, breed mean scores as published, and how the schemes compare with the OFA system used by the AKC.
What the Data Shows

Effective Population Size and Why the Coefficient of Inbreeding Has a Threshold
The metrics used to measure genetic diversity in pedigree populations — COI, effective population size — and the published thresholds below which conservation geneticists flag population viability risk, illustrated with figures from named breed studies.
What the Data Shows
-
What the Data Shows
What Finnish and Swedish Pet Insurance Records Have Added to the Picture
The Finnish and Swedish insurance datasets used in breed health research — the insurers involved, the scale of the databases and how their morbidity and mortality figures have been cited in peer-reviewed papers alongside VetCompass data.